Market Structure Trading Explained: A Beginner's Guide to Reading Price
Market structure is the pattern of highs and lows that tells you whether a market is trending or turning. Here's how to read and mark it on any chart — the foundation under price action and smart money concepts.
Ask ten traders what they look at first and you'll get ten answers — indicators, patterns, news, gut feel. Ask a trader who's actually consistent, and most of them will tell you the same thing: they read the structure first. Everything else is a detail layered on top.
Market structure is the least glamorous skill in trading and quietly the most important. It's also free, works on any market, and takes nothing but your eyes. Let's break down what it is and how to read it.
What "market structure" actually means
Market structure is simply the pattern made by a market's swing highs and swing lows — the peaks and troughs price leaves behind as it moves. That pattern tells you one thing that matters more than almost anything else: which direction the market is actually moving, and whether that's still true.
A swing high is a peak with lower candles on either side of it. A swing low is a trough with higher candles on either side. String them together and they form a shape. Reading that shape is reading market structure.
The three states a market can be in
Every chart, on every timeframe, is doing one of three things. Learn to name which, and you've already filtered out most bad trades.
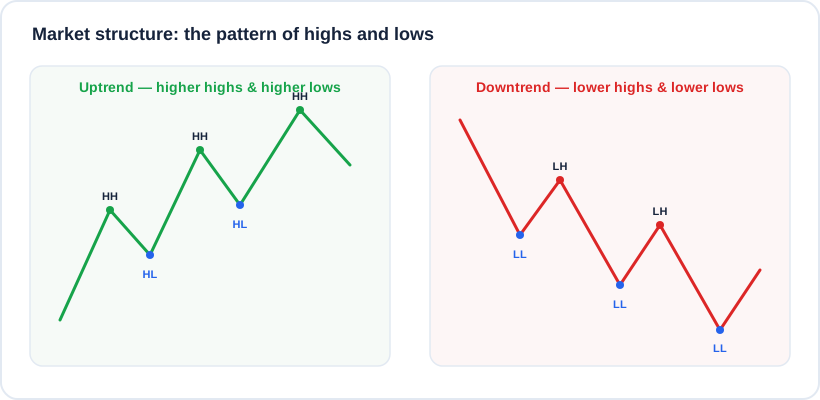
An uptrend prints higher highs and higher lows; a downtrend prints lower highs and lower lows. A range does neither.
| State | What the highs and lows do | What it's telling you |
|---|---|---|
| Uptrend | Higher highs (HH) and higher lows (HL) | Buyers are in control — each dip is bought at a higher level |
| Downtrend | Lower highs (LH) and lower lows (LL) | Sellers are in control — each bounce is sold at a lower level |
| Range | Roughly equal highs and lows | Neither side is winning — price is bouncing between a floor and a ceiling |
That's the whole framework. An uptrend is a market making higher highs and higher lows. The moment it stops doing that, something has changed — and that change is your earliest, cleanest signal that the trend may be ending.
How to mark structure on a chart, step by step
You don't need software or an indicator. Here's the process on any chart:
- Pick your timeframe and zoom out. Structure only makes sense with context. Look at enough history to see several swings, not just the last few candles.
- Mark the obvious swing highs and lows first. Ignore the tiny wiggles — mark the peaks and troughs that clearly stand out. Structure is fractal, so start with the big, obvious ones.
- Read left to right. Are the highs climbing and the lows climbing? Uptrend. Both falling? Downtrend. Going sideways between a clear high and low? Range.
- Label as you go. Literally write HH, HL, LH, LL on the chart while you learn. It forces you to be honest about what price is doing instead of what you hope it's doing.
Do this on twenty charts and it stops being a chore — you'll start seeing the structure the instant a chart loads.
When structure breaks: the early warning
Get the Top 5 Price Action Secrets
Read charts without indicators — market structure, support/resistance, and confirmation-based entries, on real charts. Enter your email and we'll send the free PDF to your inbox.
Here's where it gets useful. As long as an uptrend keeps making higher highs and higher lows, you assume it continues. The signal to pay attention comes when price fails to make a higher high, then breaks below the last higher low. That break is the first evidence that buyers have lost control.
That exact moment — a break of the prior structure — is what smart-money traders call a break of structure or a change of character, depending on which way it cuts. They're just precise names for "the structure changed." If you want the full breakdown of those two signals, our guide to BOS vs CHoCH walks through them with charts. But you don't need the jargon to use the idea: when the pattern of highs and lows breaks, your assumption about the trend should break with it.
Why this is the foundation under everything
Market structure isn't a strategy on its own — it's the base that every strategy sits on.
If you trade price action, your entries live at structure: buying a higher low that holds, selling a lower high that rejects. If you trade smart money concepts, structure is the skeleton — liquidity, order blocks and premium/discount all get read relative to the current structure. Even options traders lean on it to decide whether a stock's trend supports the direction of their trade.
Get structure right and your levels, entries and risk all have context. Skip it, and you're trading setups in a vacuum — which is how people end up buying into downtrends because a candle looked nice.
Common mistakes beginners make
- Marking every wiggle. Not every little bump is a swing. If you label noise, your structure becomes a mess and every trade looks valid. Zoom out and mark what clearly stands out.
- Forcing a trend that isn't there. Ranges are normal and common. If the highs and lows are roughly flat, it's a range — trade it as one or stand aside, don't pretend it's a trend.
- Ignoring the higher timeframe. A pullback on the 5-minute can be a healthy higher low on the daily. Always check the structure one or two timeframes up before you trust the one you're trading.
- Reacting to one candle. A trend isn't broken by a single red candle — it's broken when the structure breaks. Wait for the level, not the emotion.
Key takeaways
- Market structure is the pattern of swing highs and lows — it tells you the trend before any indicator does.
- Uptrend = higher highs and higher lows. Downtrend = lower highs and lower lows. Range = neither.
- Mark the obvious swings, read left to right, and label them until it's automatic.
- When structure breaks, your trend assumption should too — that break is your earliest warning.
- It's the foundation under price action, smart money concepts, and sound risk-taking.
Reading structure well won't make every trade a winner — nothing does. What it does is stop you fighting the market: you stop buying downtrends, stop selling uptrends, and start taking trades that agree with where price is actually going. That single habit separates a lot of consistent traders from frustrated ones.
If you want a structured way to build this skill from the ground up, VASA's free Top 5 Price Action Secrets guide starts exactly here — reading the chart itself, no indicators required. And once you can see structure, our free position-size calculator helps you take those setups with risk defined before you enter.
Frequently asked questions
What timeframe should I read market structure on? Whichever one you trade — but always sanity-check the structure one or two timeframes higher. A move that looks like a reversal on a low timeframe is often just a normal pullback within a higher-timeframe trend.
Is market structure the same as support and resistance? They're related but not identical. Support and resistance are price levels that have held before; market structure is the pattern of highs and lows over time. Structure tells you the trend; support and resistance tell you where it might pause or turn.
Do I need indicators to read market structure? No. Structure is read directly from price — the swing highs and lows. That's the whole point: it works on any market, any timeframe, with nothing but the chart.
How is this different from smart money concepts? It isn't different so much as underneath it. Smart money concepts read the same highs and lows, then add a layer of interpretation (liquidity, order blocks, premium and discount). Master plain structure first and the rest of SMC gets much easier — see our price action vs smart money concepts breakdown.
Get the Top 5 Price Action Secrets
Read charts without indicators — market structure, support/resistance, and confirmation-based entries, on real charts. Enter your email and we'll send the free PDF to your inbox.
Prefer to watch first? Watch the free training
Educational content only — not financial advice. Trading involves substantial risk of loss and is not suitable for everyone.